
ledgers.cloudledgers.cloud
India
UAE
USA
AI Agents
PRO Platform
Developers
Pricing
About
LEDGERS Logo

Completely integrated suite of cloud-based tools to help you with invoicing, payments, accounting, inventory management, payroll, GST compliance and more.

Company

  • About Us
  • Contact Us

Usage

  • Terms & Conditions
  • Privacy Policy
  • Assured Terms

Trusted & Certified

ISO 22301 BCMS CertifiedISO 27001 ISMS Certified

Download App

Get it on Google PlayDownload on the App Store
© 2026 LEDGERS. All rights reserved.
What IS KEY Performance Indicator KPI
HARISH BABU KM

HARISH BABU KM

Updated on 31-10-2026

Key Performance Indicator (KPI) - A Complete Guide

Overview

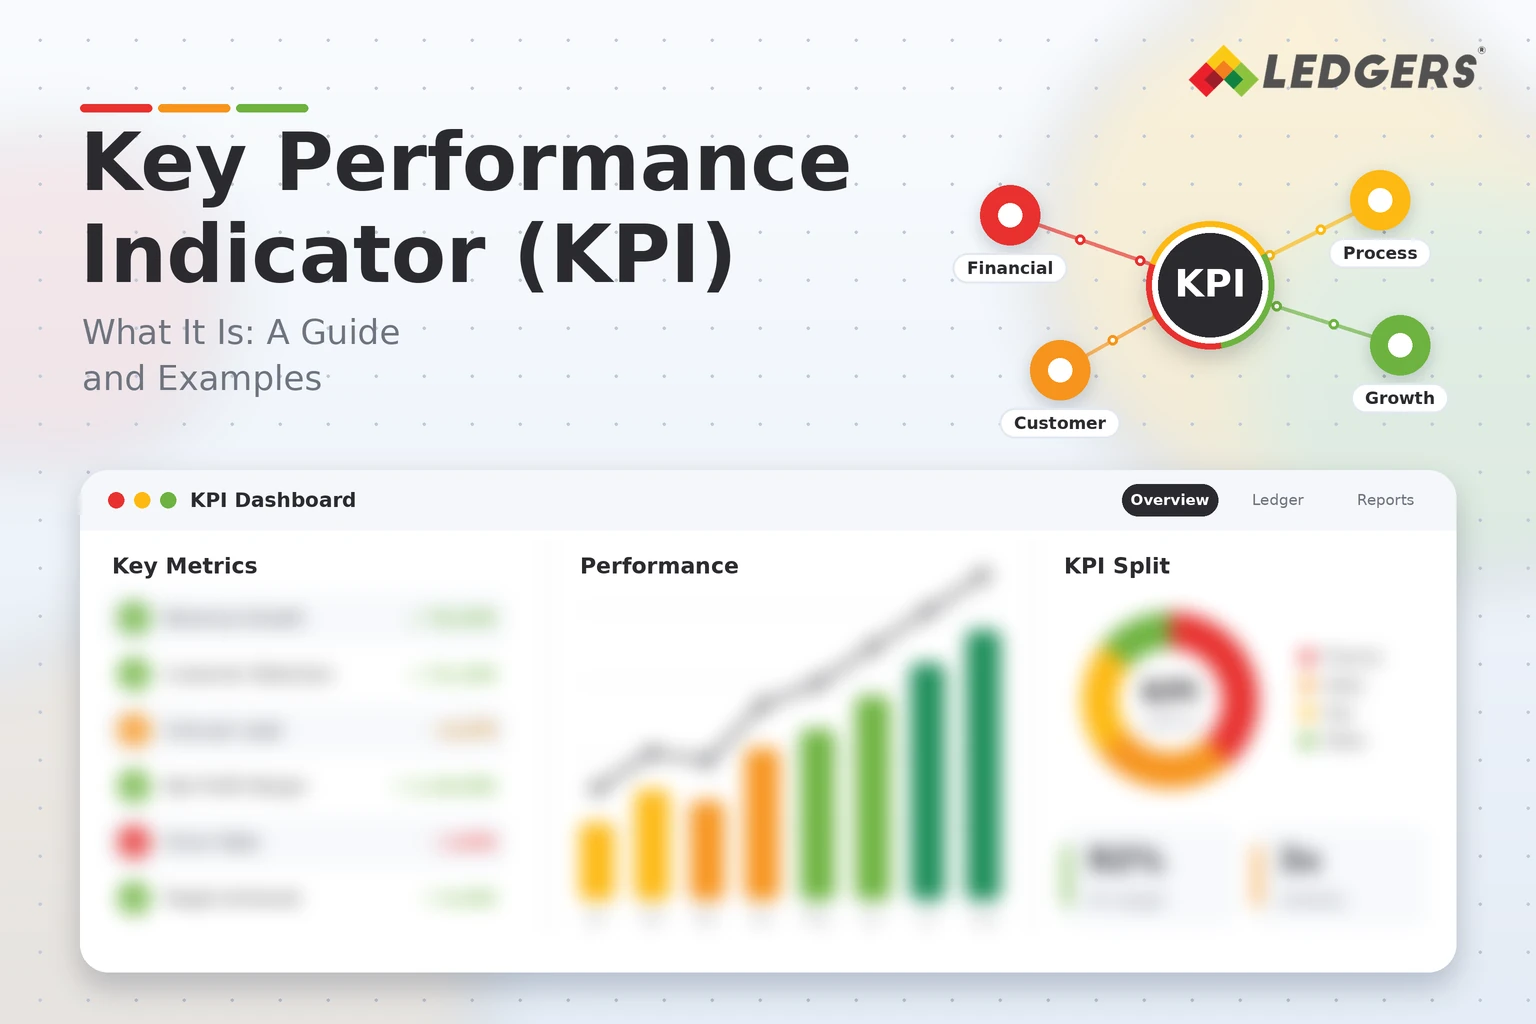
A key performance indicator or KPI, is a measurable value that shows how well a person, team or business is moving towards a goal.Every business wants higher profit, faster collections, happier customers, or lower employee turnover, but goals alone don’t show whether you’re on track. A KPI turns a broad goal into a specific number, a target, and a time frame, so decisions become clearer and progress is easy to see. 

This guide explains what a KPI is, the different types of KPIs, and the metrics most commonly used in finance, HR, sales, and payroll. It also shows how HR teams calculate KPIs and how the process can be automated with the best payroll management software. 

Table of Contents

  1. What Is a Key Performance Indicator
  2. Why KPIs Matter for Your Business
  3. Types of KPIs
  4. How to Choose and Set the Right KPIs
  5. Popular KPI’s 
  6. How HR uses KPI to measure performance
  7. How Payroll software helps calculate KPI
  8. Common KPI Mistakes to Avoid

What Is a Key Performance Indicator

A key performance indicator is a quantifiable measure linked to a specific business objective. It answers one simple question: are we getting closer to what we want to achieve?

A good KPI has four parts:

  • Clear objective
  • Right metrics 
  • Achievable Target
  • Time period

Without these parts, a number is just data. Including them, it becomes a useful signal.

Why KPIs Matter for Your Business

KPIs bring focus. Instead of watching dozens of figures, your team concentrates on the few that really drive results.

The main benefits are easy to see:

  • Everyone understands what success looks like
  • Problems show up early, before they become expensive
  • Decisions rely on facts rather than opinions
  • Progress is simple to share with owners, managers and investors
  • Teams stay motivated because they can see their own impact

For growing businesses, KPIs also create a common language between finance, operations, sales and HR.

Types of KPIs

KPIs can be grouped in a few useful ways:

  • Strategic KPIs show progress toward long term goals, such as annual revenue growth.
  • Operational KPIs track daily or weekly activity, such as orders processed or tickets resolved.
  • Financial KPIs measure money related results, such as profit margin or cash conversion.
  • Leading KPIs predict future results, such as the number of sales demos booked.
  • Lagging KPIs confirm past results, such as last quarter’s revenue.

A balanced set usually includes both leading and lagging indicators, so you can see what is coming and what has already happened.

How To Choose And Set The Right KPIs

Choosing KPIs works best when you follow a simple process:

  • Start with the goal. Pick the business objective first, then the metric.
  • Make it SMART. Each KPI should be specific, measurable, achievable, relevant and time bound.
  • Limit the list. Five to seven KPIs per team is usually enough.
  • Assign an owner. Someone should be responsible for each number.
  • Set a baseline and target. Know where you are today and where you want to be.
  • Review regularly. Check progress weekly or monthly and adjust if needed.

Popular KPI’s 

    Different teams need different indicators. Here are some common ones:

  • Finance: net profit margin, days sales outstanding, operating cash flow
  • HR and payroll: employee attrition rate, payroll accuracy rate, time to hire
  • Sales: conversion rate, average deal size, sales cycle length
  • Marketing: cost per lead, website conversion rate and spend
  • Customer support: first response time, resolution rate, customer satisfaction score
  • Operations: order fulfilment time, defect rate, on time delivery rate

The table below shows how popular KPIs are calculated and what they tell you.

KPI

Department

Formula

What It Tells You

Net profit margin

Finance

Net profit ÷ revenue × 100

How much profit you keep from each sale

Days sales outstanding

Finance

Receivables ÷ credit sales × number of days

How quickly customers pay

Conversion rate

Sales

Customers won ÷ total leads × 100

How effective your sales process is

Customer acquisition cost

Marketing

Sales and marketing spend ÷ new customers

How much it costs to win a customer

Customer satisfaction score

 Support

Positive responses ÷ total responses × 100

How happy your customers are

How HR Uses KPIs to Measure Performance

HR teams use KPIs to track how employees perform, how long they stay, and how well HR processes work. Instead of relying on opinions alone, they measure numbers such as:

  • Employee turnover rate: the percentage of employees who leave in a period. If 12 of 100 leave in a year, turnover is 12%.
  • Absenteeism rate: the share of working days lost to unplanned absence, such as 40 out of 1,000 days (4%).
  • Time to hire: the average days from job posting to offer acceptance, such as 30 days.
  • Cost per employee: total employment cost divided by headcount.

How Payroll Software Helps Calculate HR KPIs

Many HR KPIs depend on data that already sits in the payroll system, such as attendance, leave, overtime, salary, and exit records. The best payroll management software in India can use this data to calculate KPIs automatically instead of relying on manual spreadsheets. For example, it can:

  • Calculate absenteeism by pulling attendance and leave records directly.
  • Track overtime by comparing regular and extra hours for each employee or department.
  • Measure turnover using joining and exit dates.
  • Show payroll cost per employee by combining salary, bonuses, and statutory contributions.
  • Generate real-time reports and dashboards so HR can review KPIs monthly without extra effort.

This saves time, reduces manual errors, and gives HR leaders reliable numbers they can act on.

Common KPI Mistakes to Avoid

Even good teams make avoidable mistakes when working with KPIs. Watch out for these:

  • Tracking too many KPIs: too many numbers hide what really matters.
  • Choosing vanity metrics: numbers like page views look good but don’t link to business goals.
  • Setting poor targets: goals that are unrealistic or too easy lose their purpose.
  • Skipping ownership: every KPI needs a person responsible for it.
  • Reviewing too rarely: data you check once in a while is data you can’t act on.
  • Never updating KPIs: when business goals change, your KPIs should change with them.

The cure is simple: keep KPIs few, relevant and reviewed on a regular schedule.

Conclusion

Every team needs KPIs to measure the success of the company as a whole. But the process can feel complicated when data is scattered across invoicing, payroll, GST, and reports. That’s where Ledgers makes the difference. By bringing all your data under one roof, Ledgers makes KPI tracking simple, accurate, and easy to measure, so you can spend less time chasing numbers and more time growing your business.

Ready to simplify your KPI tracking? Explore Ledgers today and see how organized data can turn your goals into results.

Related Guides

MIS Report Guide : Definition, Types, Format & HR Template
Notice Period Buyout in India: Rules, Calculation and Tax Treatment
Key Performance Indicator (KPI) - A Complete Guide
Full and Final Settlement : Rules, Employee Benefits and Steps for calculation
Understanding Employee Rights in Payroll and Salary Payments
Business Spending Intelligence with Ledgers